Viewing logs in released apps
Whether you’re using a logging framework or the humble print function, logs provide a window into how your app is working (or not working) in real-time. Being able to view logs can help you more quickly locate and fix errors than you would be able to by only observing your app’s behavior.
Developers most often see log output while coding an app, but did you know you can also see logs for release apps without needing to attach a debugger?
logcat for Android
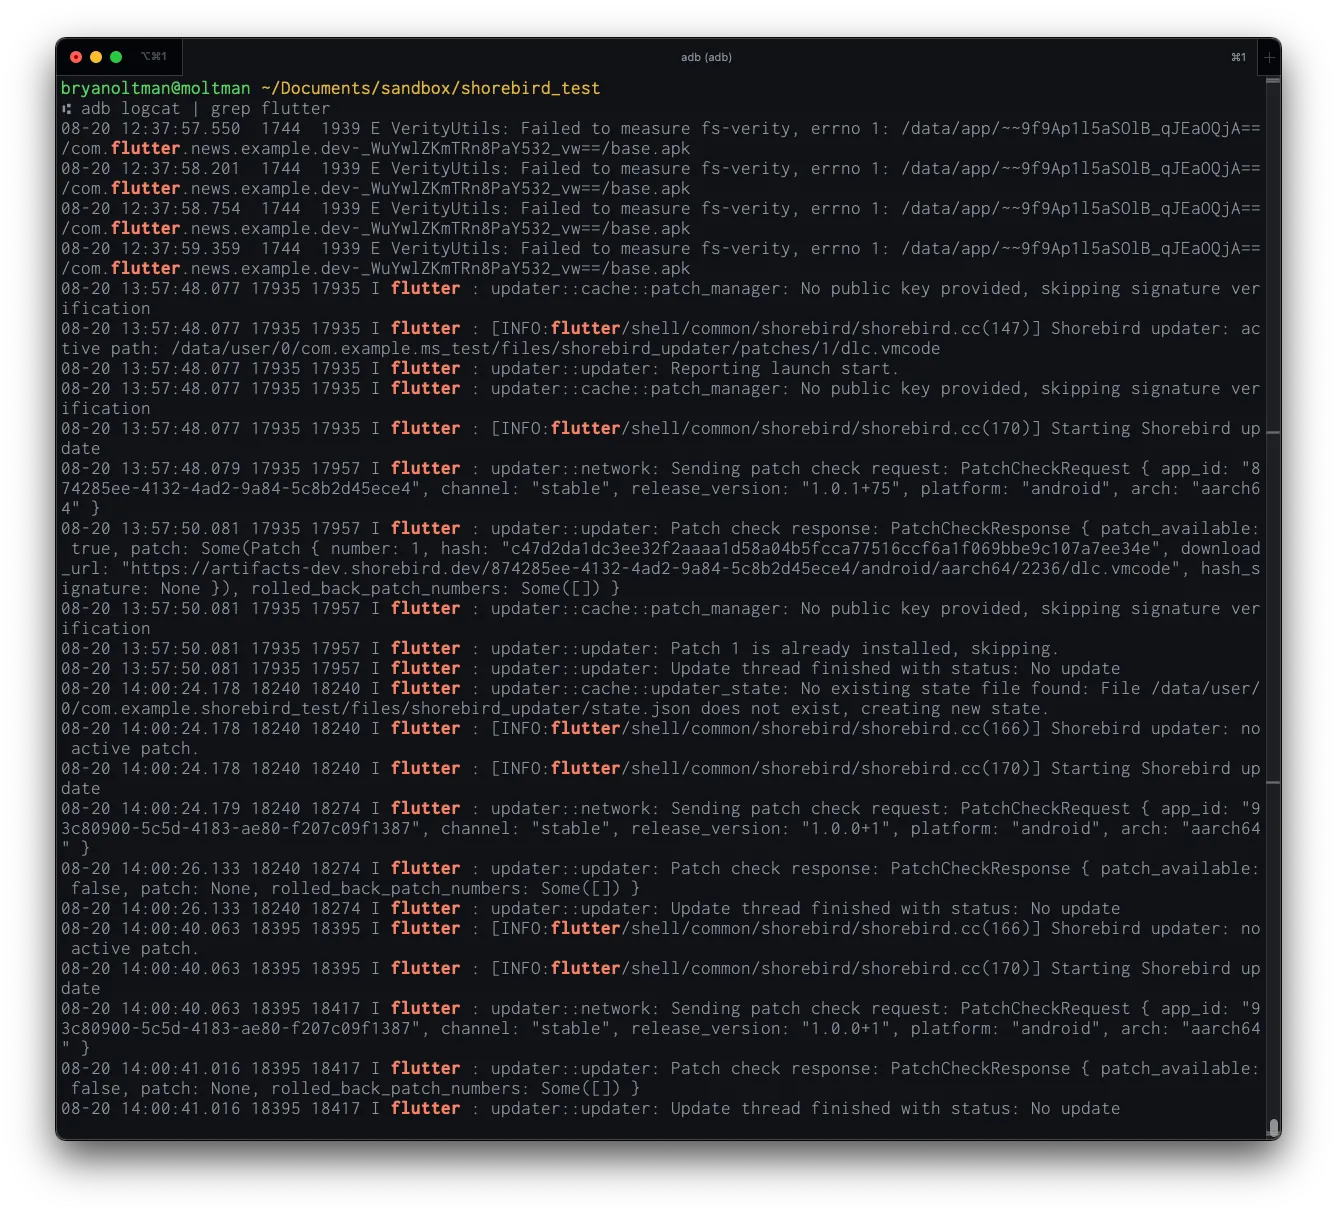
All Android system output can be viewed using the logcat command line tool. You can try this out by connecting your Android device via USB and running adb logcat in your terminal.
Note: adb will need to be on your path for this to work. If you see an error like command not found: adb or 'adb' is not recognized as an internal or external command, you will need to add adb to your PATH. StackOverflow has good answers to help with this for macOS/Linux and Windows
Without any filtering, adb logcat is very noisy. To show just the output for your Flutter app, you can filter the output using adb logcat | grep flutter on macOS/Linux or adb logcat | findstr flutter on Windows.

Console.app for iOS
macOS includes a utility app named Console that shows all system logs.
To open the Console app, type ⌘ + Space, type ‘Console’, and press Enter.
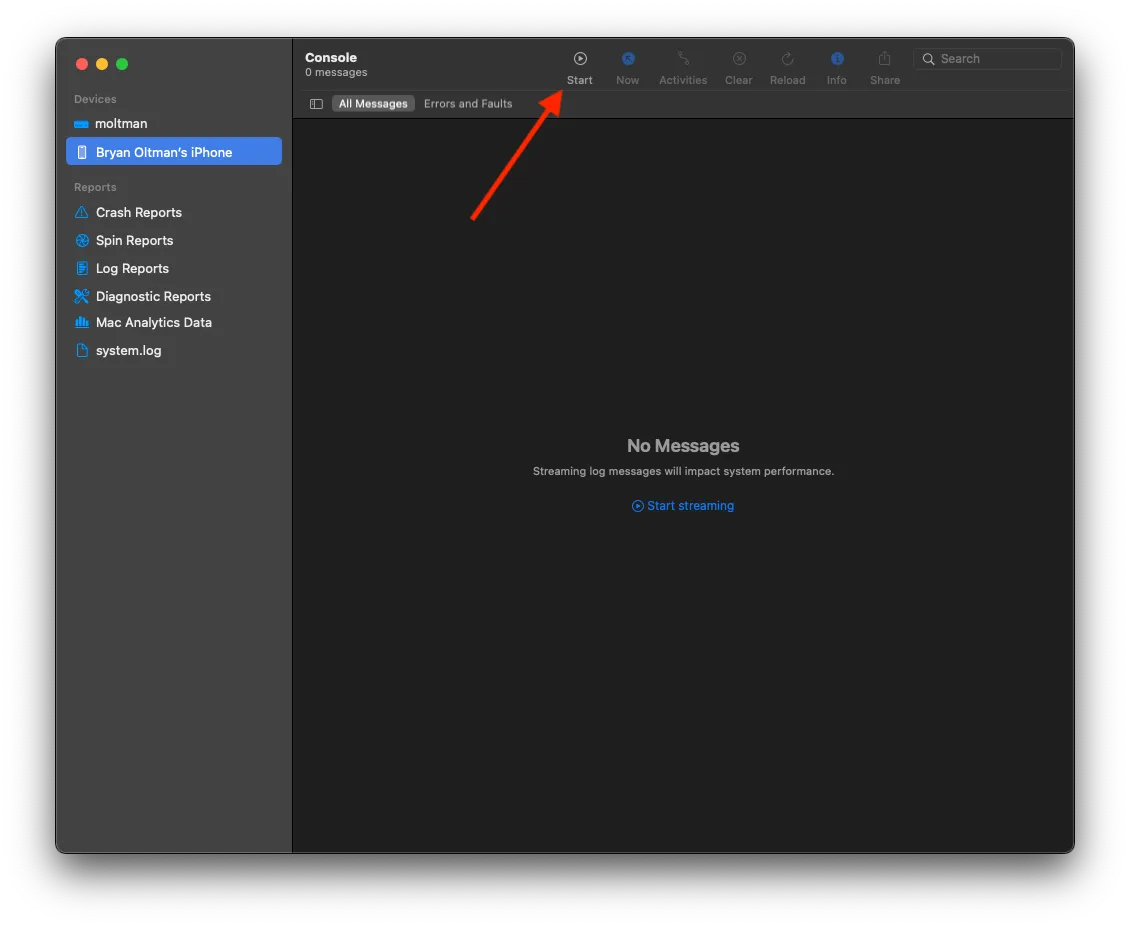
By default, this shows logs for your Mac, but it can also be used to view logs for your iPhone, iPad, Apple Watch, etc.
To see system logs, connect your device to your Mac via USB, select it in the left column, and press the “Start” button in the top toolbar.

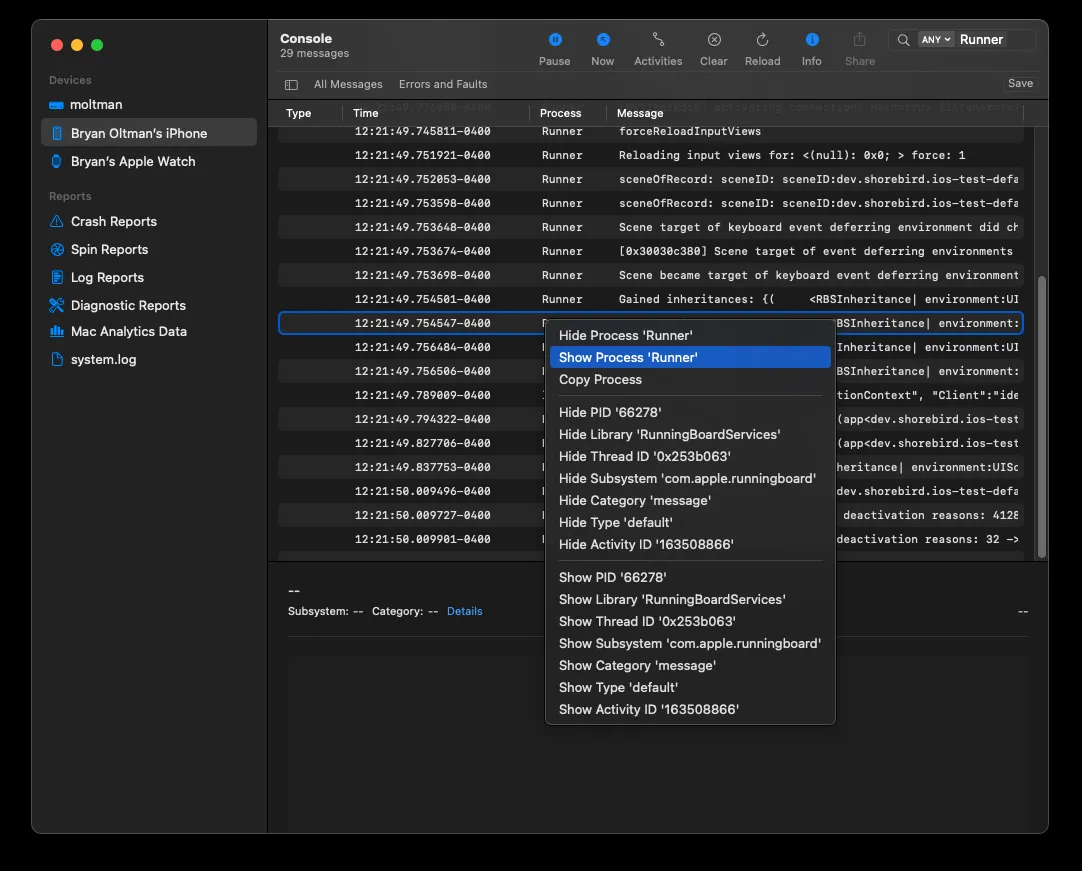
Without filtering, these logs are very noisy. To filter out logs that are not from your app, type your app’s name in the search bar and press enter (for Flutter apps, this defaults to “Runner”). You can then right-click on “Runner” in the Process column and select “Show Process ‘Runner’”

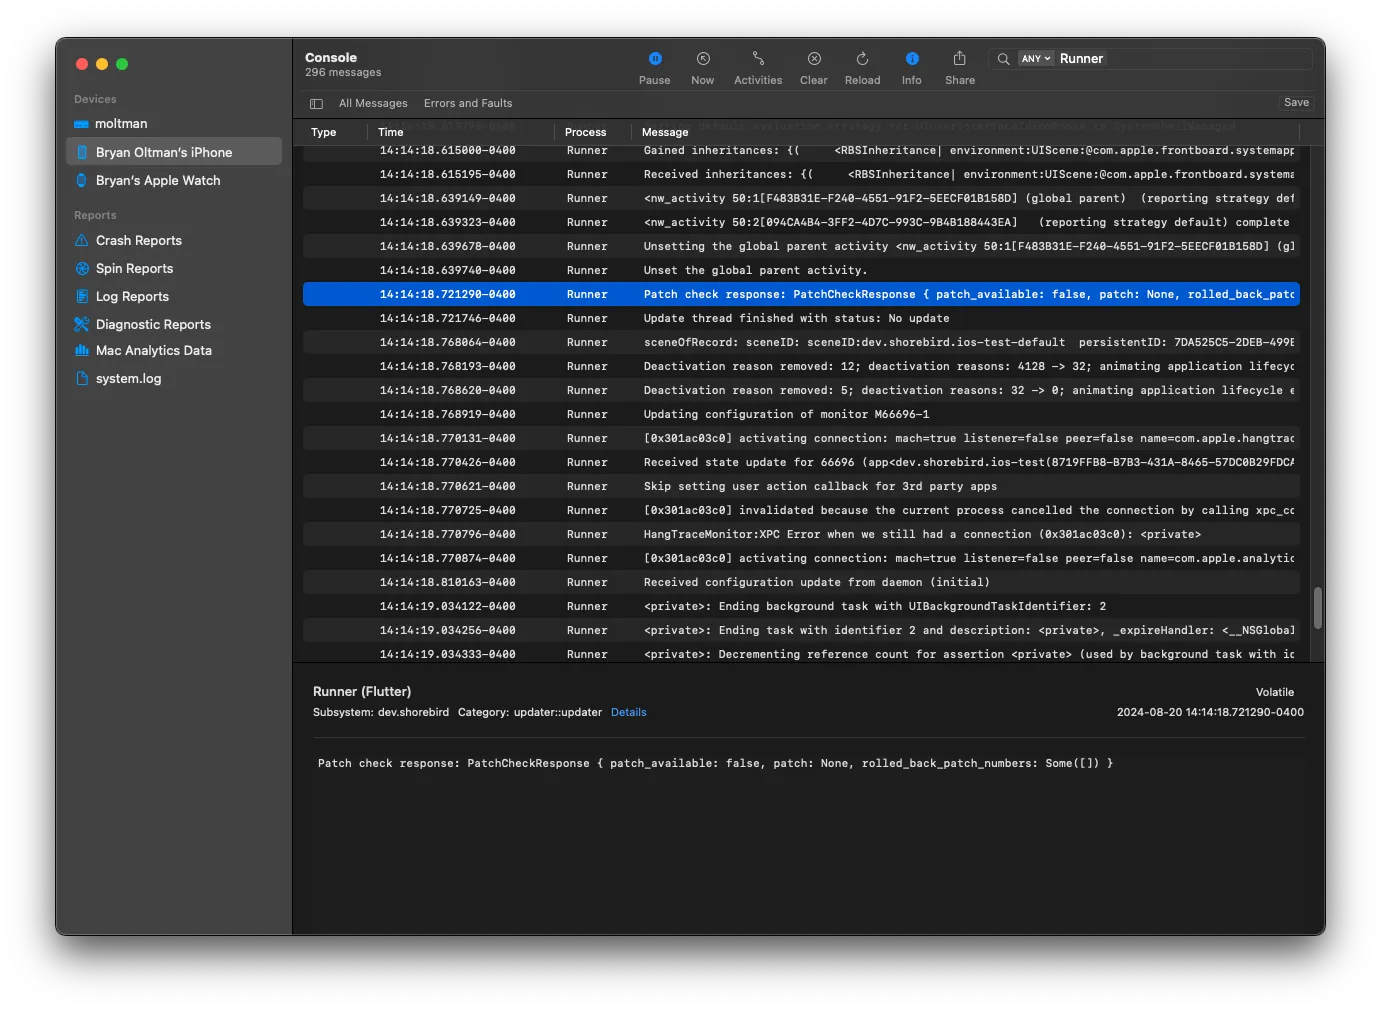
With this filter applied, we are only shown logs that apply to our app.

